This site is from a past semester! The current version will be here when the new semester starts.
CS2113/T 2021 Jan-May
  • Full Timeline
  • Week 1 [Mon, Jan 11th]
  • Week 2 [Mon, Jun 21st]
  • Week 3 [Mon, Jun 28th]
  • Week 4 [Mon, Jul 5th]
  • Week 5 [Mon, Jul 12th]
  • Week 6 [Mon, Jul 19th]
  • Week 7 [Mon, Jul 26th]
  • Week 8 [Mon, Aug 9th]
  • Week 9 [Mon, Aug 16th]
  • Week 10 [Mon, Aug 23rd]
  • Week 11 [Mon, Aug 30th]
  • Week 12 [Mon, Sep 6th]
  • Week 13 [Mon, Sep 13th]
  • Textbook
  • Admin Info
  • Dashboards
  •  Individual Project (iP):
  • Individual Project Info
  • iP Upstream Repo
  • iP Code Dashboard
  • iP Progress Dashboard

  •  Team Project (tP):
  • Team Project Info
  • Reference AB3
  • Team List
  • tP Code Dashboard
  • tP Progress Dashboard
  • Java exercises
  • Report Bugs
  • Forum
  • Gitter (Chat)
  • Instructors
  • Announcements
  • Files (handouts, submissions etc.)
  • Tutorial Schedule
  • Java Coding Standard
  • Git Conventions
  • Forum Activities Dashboard
  • Participation Dashboard
  • Modeling

    Introduction

    Can explain models

    A model is a representation of something else.

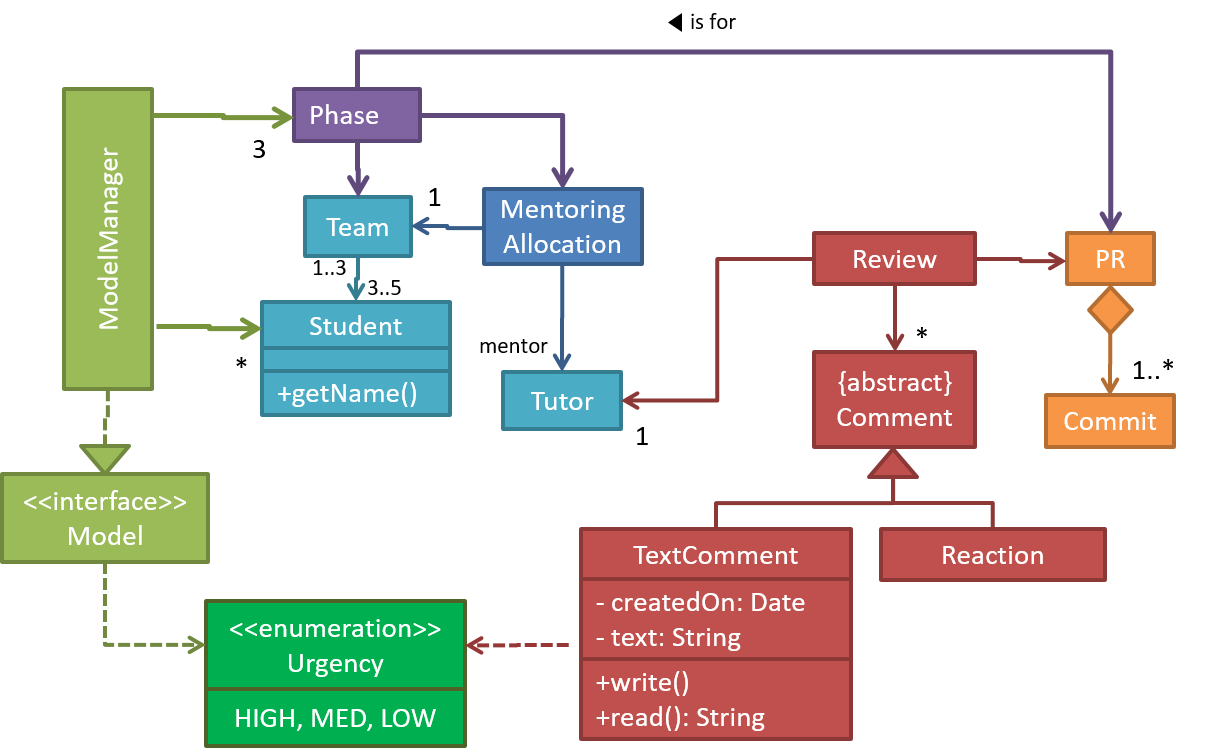
    A class diagram is a model that represents a software design.

    A class diagram is a diagram drawn using the UML modelling notation.
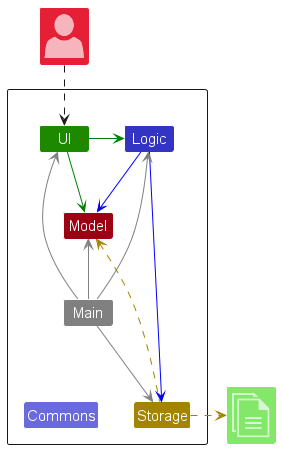
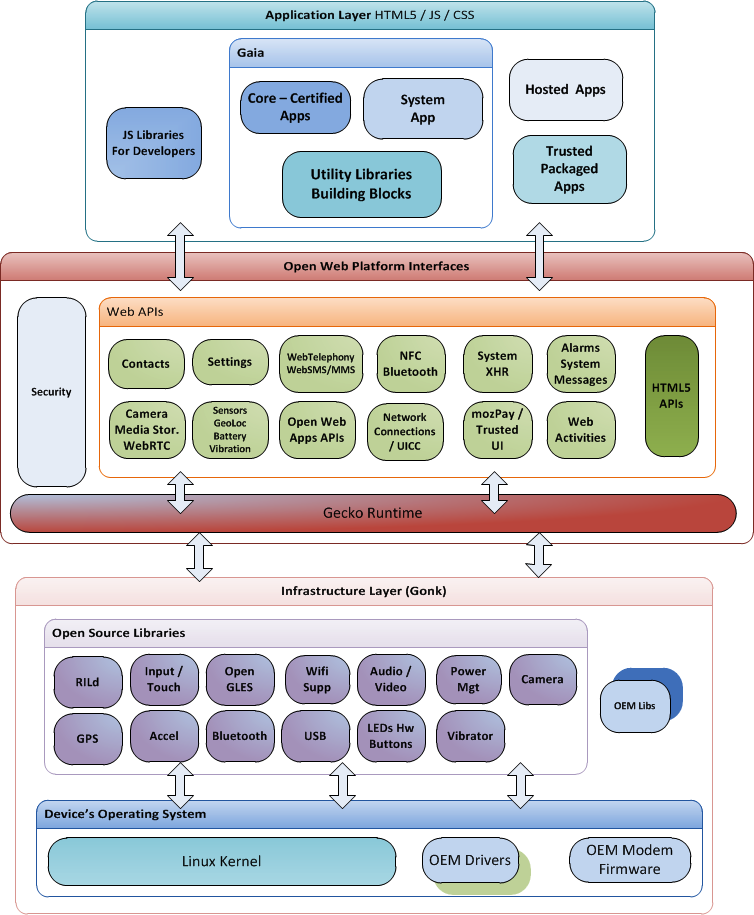
    An example class diagram:

    A model provides a simpler view of a complex entity because a model captures only a selected aspect. This omission of some aspects implies models are abstractions.

    Design → Design Fundamentals → Abstraction →

    What

    Abstraction is a technique for dealing with complexity. It works by establishing a level of complexity we are interested in, and suppressing the more complex details below that level.

    The guiding principle of abstraction is that only details that are relevant to the current perspective or the task at hand need to be considered. As most programs are written to solve complex problems involving large amounts of intricate details, it is impossible to deal with all these details at the same time. That is where abstraction can help.

    Data abstraction: abstracting away the lower level data items and thinking in terms of bigger entities

    Within a certain software component, you might deal with a user data type, while ignoring the details contained in the user data item such as name, and date of birth. These details have been ‘abstracted away’ as they do not affect the task of that software component.

    Control abstraction: abstracting away details of the actual control flow to focus on tasks at a higher level

    print(“Hello”) is an abstraction of the actual output mechanism within the computer.

    Abstraction can be applied repeatedly to obtain progressively higher levels of abstraction.

    An example of different levels of data abstraction: a File is a data item that is at a higher level than an array and an array is at a higher level than a bit.

    An example of different levels of control abstraction: execute(Game) is at a higher level than print(Char) which is at a higher level than an Assembly language instruction MOV.

    Abstraction is a general concept that is not limited to just data or control abstractions.

    Some more general examples of abstraction:

    • An OOP class is an abstraction over related data and behaviors.
    • An architecture is a higher-level abstraction of the design of a software.
    • Models (e.g., UML models) are abstractions of some aspect of reality.
    A class diagram captures the structure of the software design but not the behavior.

    Multiple models of the same entity may be needed to capture it fully.

    In addition to a class diagram (or even multiple class diagrams), a number of other diagrams may be needed to capture various interesting aspects of the software.

    Can explain how models are used

    In software development, models are useful in several ways:

    a) To analyze a complex entity related to software development.

    Some examples of using models for analysis:

    1. Models of the i.e. the environment in which the software is expected to solve a problemproblem domain can be built to aid the understanding of the problem to be solved.
    2. When planning a software solution, models can be created to figure out how the solution is to be built. An architecture diagram is such a model.

    An architecture diagram depicts the high-level design of a software.

    b) To communicate information among stakeholders. Models can be used as a visual aid in discussions and documentation.

    Some examples of using models to communicate:

    1. You can use an architecture diagram to explain the high-level design of the software to developers.
    2. A business analyst can use a use case diagram to explain to the customer the functionality of the system.
    3. A class diagram can be reverse-engineered from code so as to help explain the design of a component to a new developer.

    c) As a blueprint for creating software. Models can be used as instructions for building software.

    Some examples of using models as blueprints:

    1. A senior developer draws a class diagram to propose a design for an OOP software and passes it to a junior programmer to implement.
    2. A software tool allows users to draw UML models using its interface and the tool automatically generates the code based on the model.
    Model Driven Development extra

    Model-driven development (MDD), also called Model-driven engineering, is an approach to software development that strives to exploit models as blueprints. MDD uses models as primary engineering artifacts when developing software. That is, the system is first created in the form of models. After that, the models are converted to code using code-generation techniques (usually, automated or semi-automated, but can even involve manual translation from model to code). MDD requires the use of a very expressive modeling notation (graphical or otherwise), often specific to a given problem domain. It also requires sophisticated tools to generate code from models and maintain the link between models and the code. One advantage of MDD is that the same model can be used to create software for different platforms and different languages. MDD has a lot of promise, but it is still an emerging technology.

    Further reading:

    Choose the correct statements about models.

    • a. Models are abstractions.
    • b. Models can be used for communication.
    • c. Models can be used for analysis of a problem.
    • d. Generating models from code is useless.
    • e. Models can be used as blueprints for generating code.

    (a) (b) (c) (e)

    Explanation: Models generated from code can be used for understanding, analysing, and communicating about the code.

    Explain how models (e.g. UML diagrams) can be used in a class project.

    Can models be useful in evaluating the design quality of a software written by students?

    Can identify UML models

    The following diagram uses the class diagram notation to show the different types of UML diagrams.

    Unified Modeling Language (UML) is a graphical notation to describe various aspects of a software system. UML is the brainchild of three software modeling specialists James Rumbaugh, Grady Booch and Ivar Jacobson (also known as the Three Amigos). Each of them had developed their own notation for modeling software systems before joining forces to create a unified modeling language (hence, the term ‘Unified’ in UML). UML is currently the de facto modeling notation used in the software industry.


    source:https://en.wikipedia.org/

    Modeling structures

    Can explain structure modeling of OO solutions

    An OO solution is basically a network of objects interacting with each other. Therefore, it is useful to be able to model how the relevant objects are 'networked' together inside a software i.e. how the objects are connected together.

    Given below is an illustration of some objects and how they are connected together. Note: the diagram uses an ad-hoc notation.

    Note that these object structures within the same software can change over time.

    Given below is how the object structure in the previous example could have looked like at a different time.

    However, object structures do not change at random; they change based on a set of rules, as was decided by the designer of that software. Those rules that object structures need to follow can be illustrated as a class structure i.e. a structure that exists among the relevant classes.

    Here is a class structure (drawn using an ad-hoc notation) that matches the object structures given in the previous two examples. For example, note how this class structure does not allow any connection between Genre objects and Author objects, a rule followed by the two object structures above.

    UML Object Diagrams are used to model object structures and UML Class Diagrams are used to model class structures of an OO solution.

    Here is an object diagram for the above example:

    And here is the class diagram for it:

    Can use basic-level class diagrams

    Contents of the panels given below belong to a different chapter; they have been embedded here for convenience and are collapsed by default to avoid content duplication in the printed version.

    Classes form the basis of class diagrams.

    Associations are the main connections among the classes in a class diagram.

    The most basic class diagram is a bunch of classes with some solid lines among them to represent associations, such as this one.

    An example class diagram showing associations between classes.

    In addition, associations can show additional decorations such as association labels, association roles, multiplicity and navigability to add more information to a class diagram.

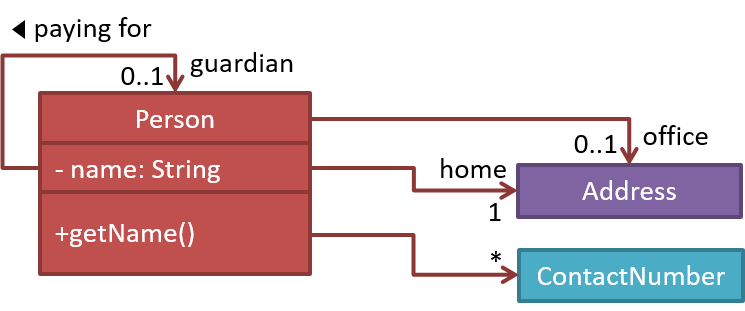
    Here is the same class diagram shown earlier but with some additional information included:

    Which association notations are shown in this diagram?

    • a. association labels
    • b. association roles
    • c. association multiplicity
    • d. class names

    (a) (b) (c) (d)

    Explanation: '1’ is a multiplicity, ‘mentored by’ is a label, and ‘mentor’ is a role.

    Explain the associations, navigabilities, and multiplicities in the class diagram below:

    Draw a class diagram for the code below. Show the attributes, methods, associations, navigabilities, and multiplicities.

    class Box {
        private Item[] parts = new Item[10];
        private Item spareItem;
        private Lid lid; // lid of this box
        private Box outerBox;
    
        public void open() {
            // ...
        }
    }
    
    class Item {
        public static int totalItems;
    }
    
    class Lid {
        Box box; // the box for which this is the lid
    }
    
    Can add more info to UML models

    UML notes can be used to add more info to any UML model.

    Can use intermediate-level class diagrams

    A class diagram can also show different types of relationships between classes: inheritance, compositions, aggregations, dependencies.

    Modeling inheritance

    Modeling composition

    Modeling aggregation

    Modeling dependencies

    A class diagram can also show different types of class-like entities:

    Modeling enumerations

    Modeling abstract classes

    Modeling interfaces

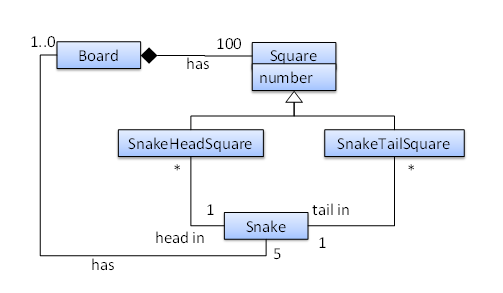
    Which of these statements match the class diagram?

    • a. A Snake must belong to at least one Board.
    • b. A SnakeHeadSquare can contain only one Snake head.
    • c. A Square can contain a Snake head.
    • d. A Snake head can be in more than one SnakeHeadSquare.
    • e. The Board has exactly 5 Snakes.

    (a)(b)(c)(d)(e)

    Explanation:

    (a) does not match because a Snake may or may not belong to a Board (multiplicity is 0..1)
    (b) matches the diagram because the multiplicity given is 1
    (c) matches the diagram because SnakeHeadSquare is a Square (due to inheritance)
    (d) matches the diagram because the multiplicity given is *
    (e) matches the diagram because the multiplicity given is 5

    Explain the meaning of various class diagram notations in the following class diagram:

    Consider the code below:

    public interface Billable {
        void bill();
    }
    
    public abstract class Item
             implements Billable {
        public abstract void print();
    }
    
    public class StockItem extends Item {
        private Review review;
        private String name;
    
        public StockItem(
            String name, Rating rating) {
    
            this.name = name;
            this.review = new Review(rating);
        }
    
        @Override
        public void print() {
            //...
        }
    
        @Override
        public void bill() {
            //...
        }
    }
    
    public enum Rating {
        GOOD, OK, POOR
    }
    
    public class Review {
        private final Rating rating;
    
        public Review(Rating rating) {
            this.rating = rating;
        }
    }
    
    import java.util.List;
    
    public class Inventory {
        private List<Item> items;
    
        public int getItemCount() {
            return items.size();
        }
    
        public void generateBill(Billable b) {
            // ...
        }
    
        public void add(Item s) {
            items.add(s);
        }
    }
    

    (a) Draw a class diagram to represent the code. Show all attributes, methods, associations, navigabilities, visibilities, known multiplicities, and association roles. Show associations as lines.
    (b) Draw an object diagram to represent the situation where the inventory has one item named spanner and a review of POOR rating
    i.e., new Inventory().add(new StockItem("spanner", new Review(Rating.POOR))).

    Can use advanced class diagrams

    A class diagram can show association classes too.

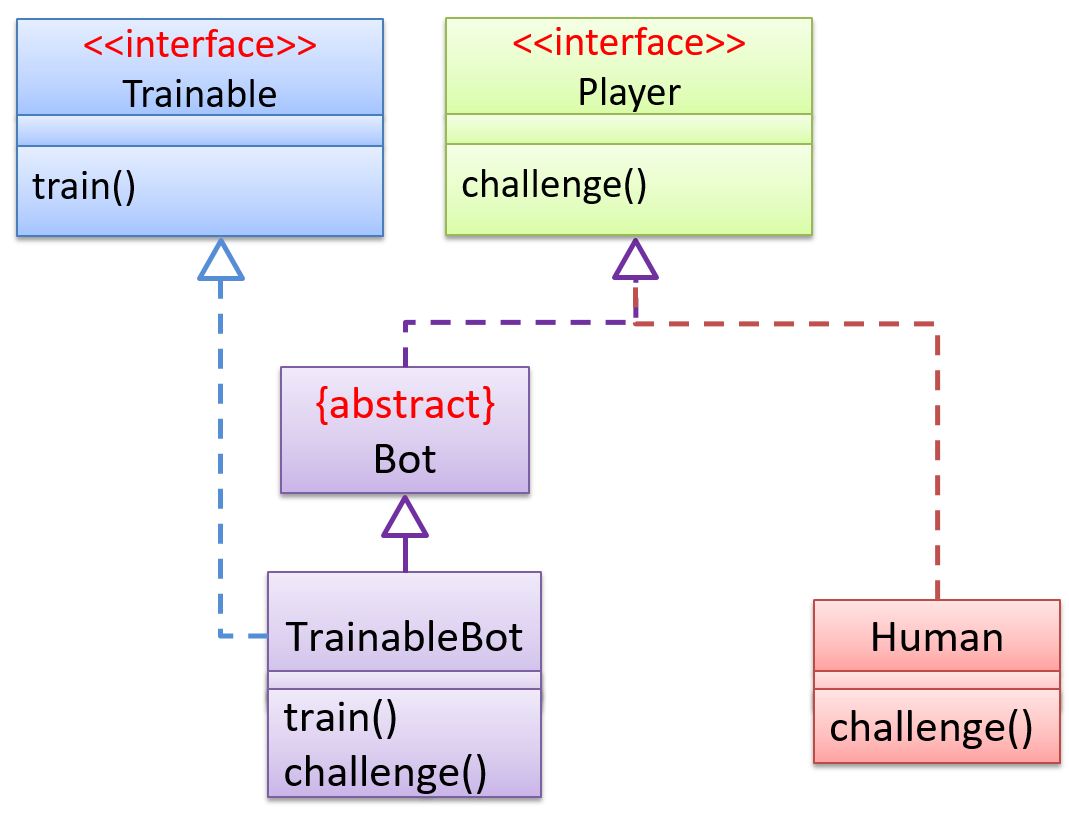
    (a) Draw a class diagram to represent the following code.

    interface Player {
        public void challenge();
    }
    
    interface Trainable {
        public void train();
    }
    
    abstract class Bot implements Player {
    
    }
    
    class TrainableBot extends Bot implements Trainable {
    
        @Override
        public void challenge() {
    
        }
    
        @Override
        public void train() {
    
        }
    }
    
    class Human implements Player {
    
        @Override
        public void challenge() {
    
        }
    }
    

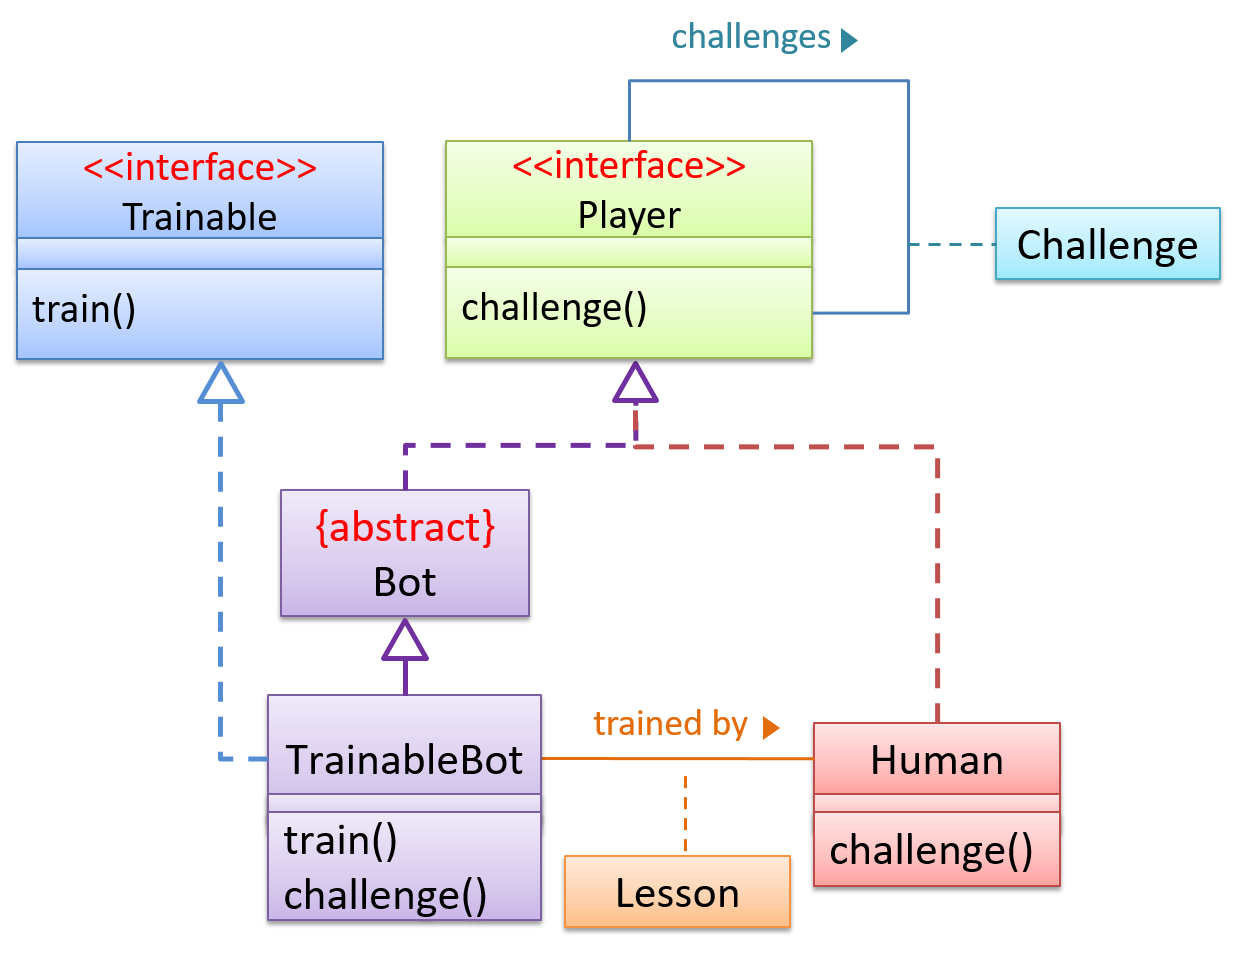
    (b) Add these association classes to the diagram:
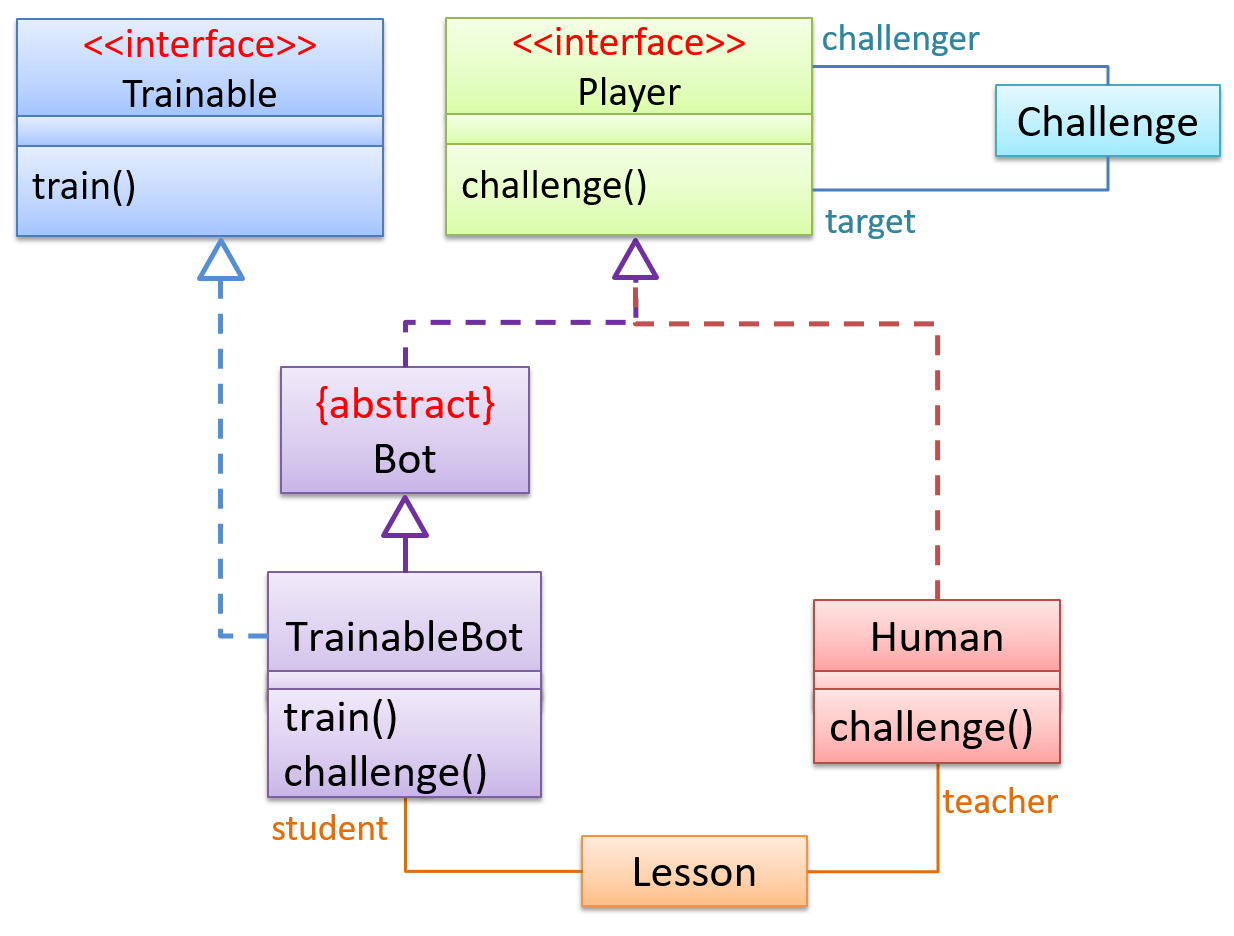
    i. A Player object can challenge another Player object. The Challenge class keeps track of the association between the two Player objects: the challenger and the target of the challenge.
    ii. A Human object can train a SmartBot object. The Lesson class keeps track of that association.

    (c) Convert the two association classes to normal classes.

    Can use basic object diagrams

    Object diagrams can be used to complement class diagrams. For example, you can use object diagrams to model different object structures that can result from a design represented by a given class diagram.

    This question is based on the following question from another topic:

    Draw a class diagram for the code below. Show the attributes, methods, associations, navigabilities, and multiplicities.

    class Box {
        private Item[] parts = new Item[10];
        private Item spareItem;
        private Lid lid; // lid of this box
        private Box outerBox;
    
        public void open() {
            // ...
        }
    }
    
    class Item {
        public static int totalItems;
    }
    
    class Lid {
        Box box; // the box for which this is the lid
    }
    

    Draw an object diagram to match the code. Include objects of all three classes in your object diagram.

    Can explain object oriented domain models

    The analysis process for identifying objects and object classes is recognized as one of the most difficult areas of object-oriented development. --Ian Sommerville, in the book Software Engineering

    Class diagrams can also be used to model objects in the the relevant information that needs to be examined to understand a problemproblem domain (i.e. to model how objects actually interact in the real world, before emulating them in the solution). Class diagrams that are used to model the problem domain are called conceptual class diagrams or OO domain models (OODMs).

    The OO domain model of a snakes and ladders game is given below.

    Description: The snakes and ladders game is played by two or more players using a board and a die. The board has 100 squares marked 1 to 100. Each player owns one piece. Players take turns to throw the die and advance their piece by the number of squares they earned from the die throw. The board has a number of snakes. If a player’s piece lands on a square with a snake head, the piece is automatically moved to the square containing the snake’s tail. Similarly, a piece can automatically move from a ladder foot to the ladder top. The player whose piece is the first to reach the 100th square wins.

    OODMs do not contain solution-specific classes (i.e. classes that are used in the solution domain but do not exist in the problem domain). For example, a class called DatabaseConnection could appear in a class diagram but not usually in an OO domain model because DatabaseConnection is something related to a software solution but not an entity in the problem domain.

    OODMs represents the class structure of the problem domain and not their behavior, just like class diagrams. To show behavior, use other diagrams such as sequence diagrams.

    OODM notation is similar to class diagram notation but omit methods and navigability.

    This diagram is,

    • a. A class diagram.
    • b. An object diagram.
    • c. An OO domain model, also known as a conceptual class diagram.
    • d. Can be either a class diagram or an OO domain model.

    (a)

    Explanation: The diagram shows navigability which is not shown in an OO domain model. Hence, it has to be a class diagram.

    What is the main difference between a class diagram and an OO domain model?

    (a)

    Explanation: Both are UML diagrams, and use the class diagram notation. While it is true that often a class diagram may have more classes and more details, the main difference is that the OO domain model describes the problem domain while the class diagram describes the solution.

    Can explain deployment diagrams

    A deployment diagram shows a system's physical layout, revealing which pieces of software run on which pieces of hardware.

    An example deployment diagram:

    source:https://commons.wikimedia.org

    Can explain component diagrams

    A component diagram is used to show how a system is divided into components and how they are connected to each other through interfaces.

    An example component diagram:


    source:https://commons.wikimedia.org

    Can explain package diagrams

    A package diagram shows packages and their dependencies. A package is a grouping construct for grouping UML elements (classes, use cases, etc.).

    Here is an example package diagram:


    source:https://commons.wikimedia.org

    Can explain composite structure diagrams

    A composite structure diagram hierarchically decomposes a class into its internal structure.

    Here is an example composite structure diagram:


    source:https://commons.wikimedia.org

    Modeling behaviors

    Can use basic-level activity diagrams

    Software projects often involve workflows. Workflows define the a connected sequence of stepsflow in which a process or a set of tasks is executed. Understanding such workflows is important for the success of the software project.

    Some examples in which a certain workflow is relevant to software project:

    A software that automates the work of an insurance company needs to take into account the workflow of processing an insurance claim.

    The algorithm of a piece of code represents the workflow (i.e. the execution flow) of the code.

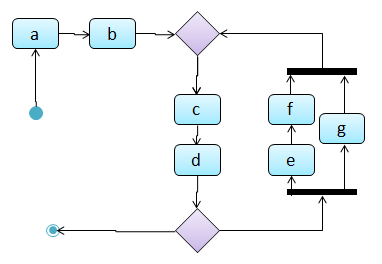
    Which of these sequences of actions is not allowed by the given activity diagram?

    • i. start a b c d end
    • ii. start a b c d e f g c d end
    • iii. start a b c d e g f c d end
    • iv. start a b c d g c d end

    (iv)

    Explanation: -e-f- and -g- are parallel paths. Both paths should complete before the execution reaches c again.

    (a) Draw an activity diagram to represent the following algorithm used for calculating the grade of a student.

    1. Read project score from keyboard
    2. Read exam score from keyboard
    3. Calculate the total
    4. Calculate the grade
    5. Print total and grade

    (b) Update the activity diagram you drew above to also include the following logic that is used when calculating the grade.

    • A: at least 25 marks for each component and at least 60 in total (for brevity, you can call this condition-A -- i.e., if condition-A is met, give grade A)
    • B: at least one component has 25 or more marks and at least 50 in total (i.e., condition-B)
    • C: otherwise

    (c) Update the diagram you drew above to incorporate the following information.

    • At the very beginning, ask the user how many grades need to be calculated.
    • Repeat the whole grade calculation process for the number of times specified by the user.


    [source:wikipeida]

    Draw an activity diagram to represent the following workflow a burger shop uses when processing an order by a customer.

    • First, a cashier takes the order.
    • Then, three workers start preparing the order at the same time; one prepares the drinks, one prepares the burgers, and one prepares the desserts.
    • In the meantime, the customer pays for the order. If the customer has a voucher, she pays using the voucher; otherwise she pays using cash.
    • After paying, the customer collects the food after all three parts of the order are ready.


    [source:wikipeida]

    Can use intermediate-level activity diagrams

    Can draw basic sequence diagrams

    Explain in your own words the interactions illustrated by this Sequence Diagram:

    Consider the code below:

    class Person {
        Tag tag;
        String name;
    
        Person(String personName, String tagName) {
            name = personName;
            tag = new Tag(tagName);
        }
    }
    
    class Tag {
        Tag(String value) {
            // ...
        }
    }
    
    class PersonList {
        void addPerson(Person p) {
            // ...
        }
    }
    

    Draw a sequence diagram to illustrate the object interactions that happen in the code snippet below:

    PersonList personList = new PersonList();
    while (hasRoom) {
        Person p = new Person("Adam", "friend");
        personList.addPerson(p);
    }
    

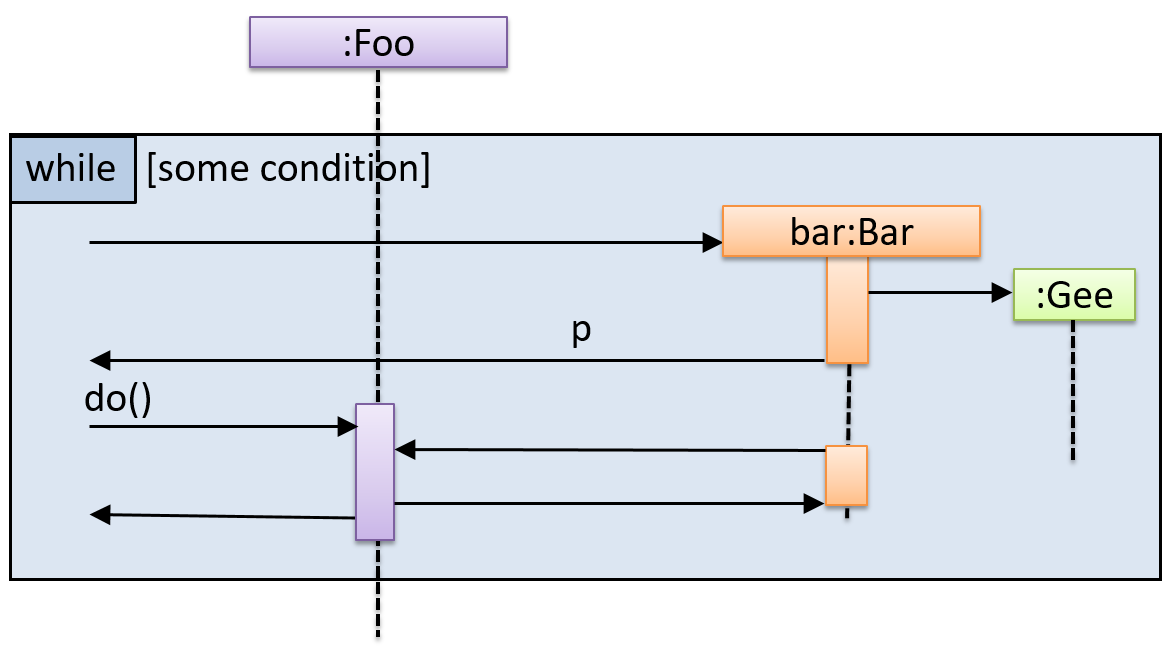
    Find notation mistakes in the sequence diagram below:

    Can draw intermediate-level sequence diagrams

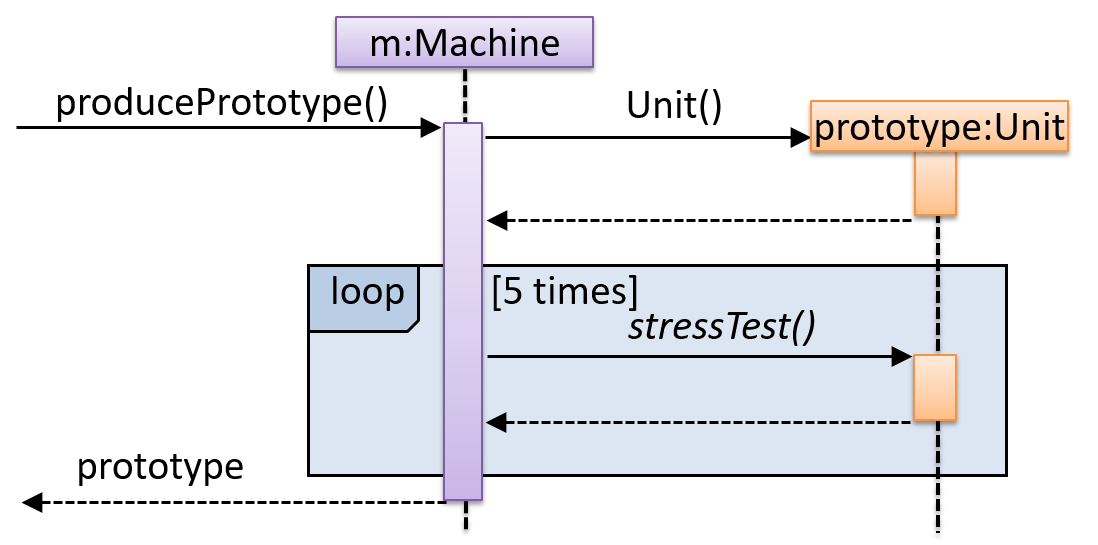
    Method calls to static (i.e., class-level) methods are received by the class itself, not an instance of that class. You can use <<class>> to show that a participant is the class itself.

    In this example, m calls the static method Person.getMaxAge() and also the setAge() method of a Person object p.

    Here is the Person class, for reference:

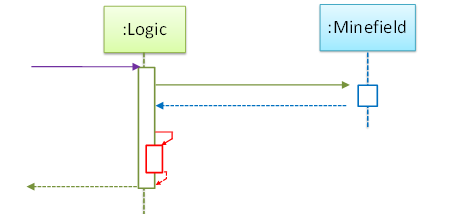
    What’s going on here?

    • a. Logic object is executing a parallel thread.
    • b. Logic object is executing a loop.
    • c. Logic object is creating another Logic instance.
    • d. One of Logic object’s methods is calling another of its methods.
    • e. Minefield object is calling a method of Logic.

    (d)

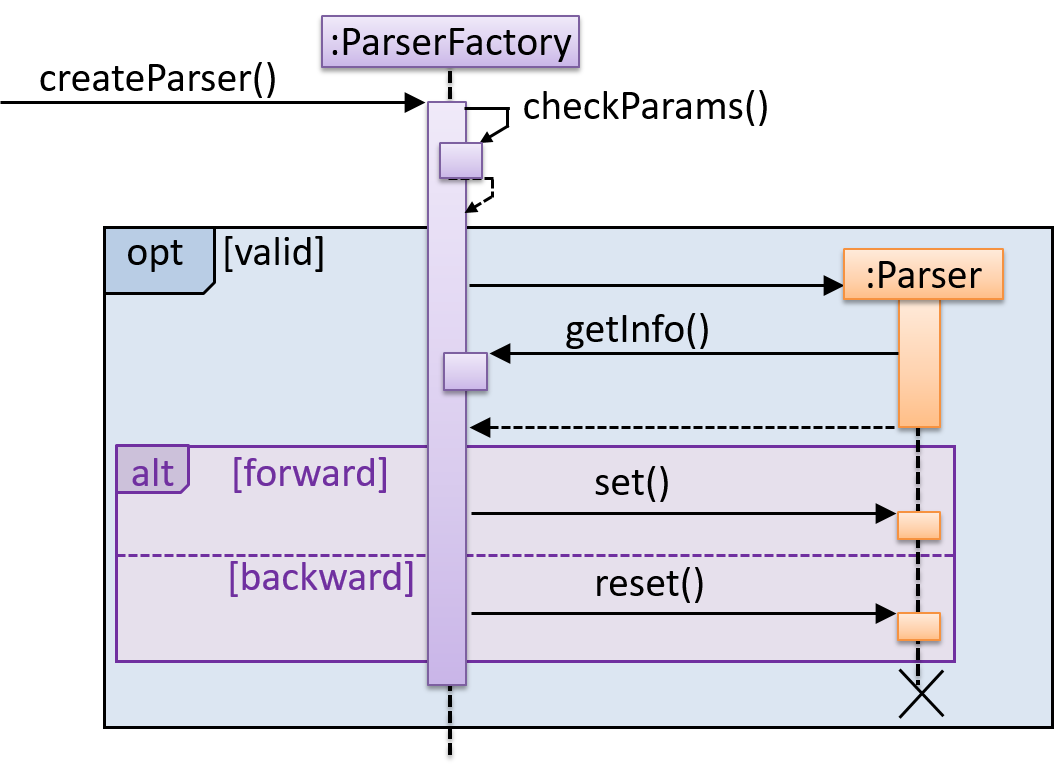
    Explain the interactions depicted in this sequence diagram.

    First, the createParser() method of an existing ParserFactory object is called. Then, ...

    Draw a sequence diagram to represent this code snippet.

    if (isFirstPage) {
        new Quote().print();
    }
    

    The Quote class:

    class Quote {
    
        String q;
    
        Quote() {
            q = generate();
        }
    
        String generate() {
            // ...
        }
    
        void print() {
            System.out.println(q);
        }
    
    }
    
    • Show new Quote().print(); as two method calls.
    • As the created Quote object is not assigned to a variable, it can be considered as 'deleted' soon after its print() method is called.
    Can explain use case diagrams

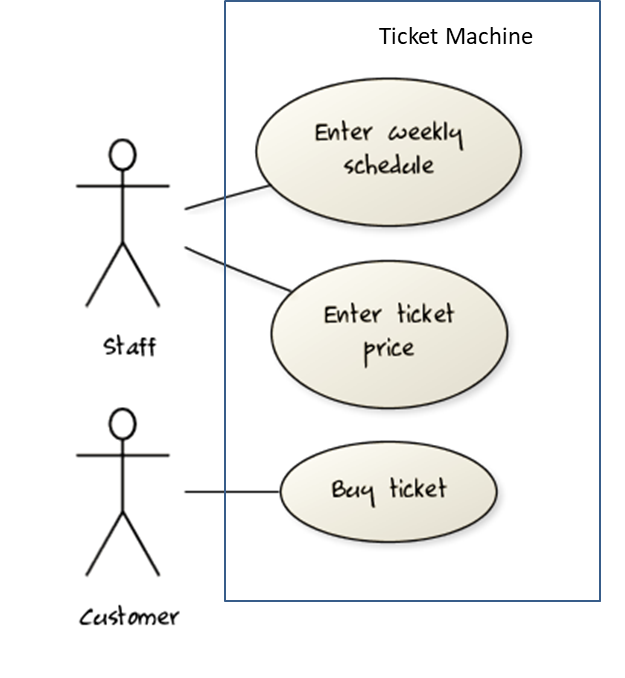
    Use case diagrams model the mapping between features of a system and its user roles.

    A simple use case diagram:

    Can explain timing diagrams

    A timing diagram focuses on timing constraints.

    Here is an example timing diagram:


    Adapted from: UML Distilled by Martin Fowler

    Can explain interaction overview diagrams

    Interaction overview diagrams are a combination of activity diagrams and sequence diagrams.

    An example:

    source: https://commons.wikimedia.org

    Can explain communication diagrams

    Communication diagrams are like sequence diagrams but emphasize the data links between the various participants in the interaction rather than the sequence of interactions.

    An example:


    Adapted from: UML Distilled by Martin Fowler

    Can explain state machine diagrams

    A State Machine Diagram models state-dependent behavior.

    Consider how a CD player responds when the “eject CD” button is pushed:

    • If the CD tray is already open, it does nothing.
    • If the CD tray is already in the process of opening (opened half-way), it continues to open the CD tray.
    • If the CD tray is closed and the CD is being played, it stops playing and opens the CD tray.
    • If the CD tray is closed and CD is not being played, it simply opens the CD tray.
    • If the CD tray is already in the process of closing (closed half-way), it waits until the CD tray is fully closed and opens it immediately afterwards.

    What this means is that the CD player’s response to pushing the “eject CD” button depends on what it was doing at the time of the event. More generally, the CD player’s response to the event received depends on its internal state. Such a behavior is called a state-dependent behavior.

    Often, state-dependent behavior displayed by an object in a system is simple enough that it needs no extra attention; such a behavior can be as simple as a conditional behavior like if x > y, then x = x - y.

    Occasionally, objects may exhibit state-dependent behavior that is complex enough such that it needs to be captured in a separate model. Such state-dependent behavior can be modeled using UML state machine diagrams (SMD for short, sometimes also called ‘state charts’, ‘state diagrams’ or ‘state machines’).

    Occasionally, objects may exhibit state-dependent behavior that is complex enough such that it needs to be captured into a separate model. Such state-dependent behavior can be modelled using UML state machine diagrams (SMD for short, sometimes also called ‘state charts’, ‘state diagrams’ or ‘state machines’).

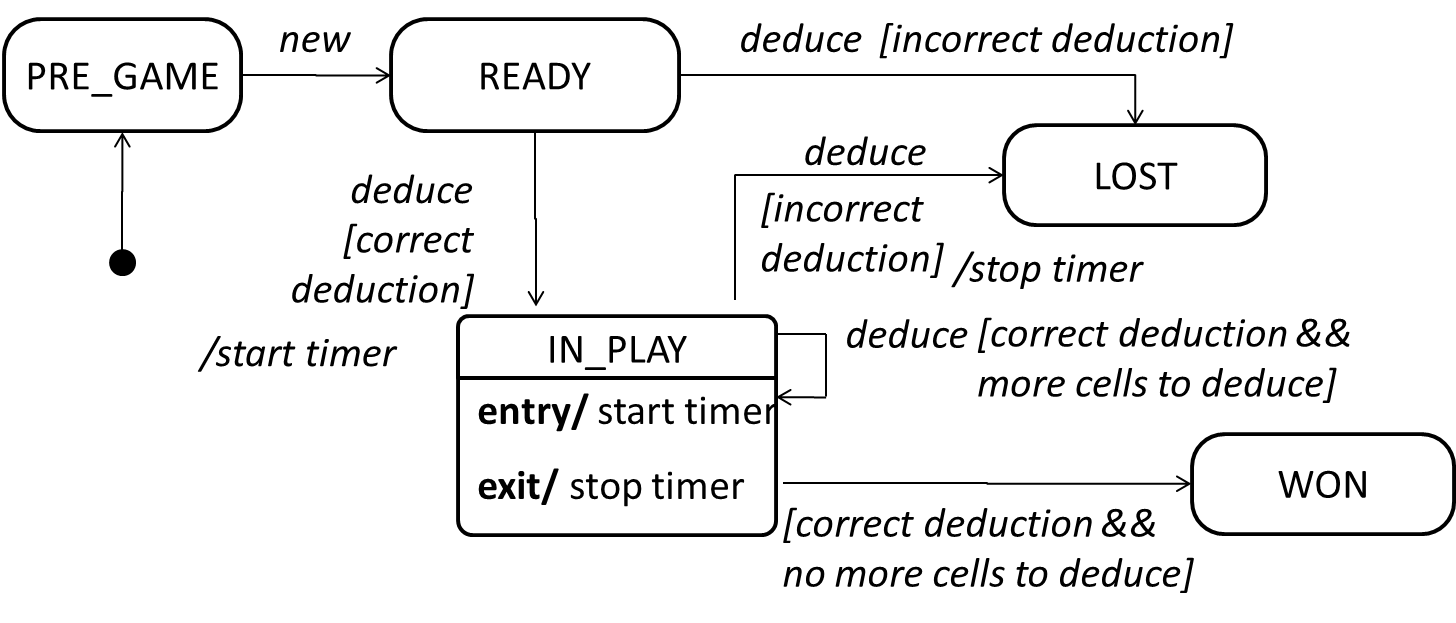
    An SMD views the life-cycle of an object as consisting of a finite number of states where each state displays a unique behavior pattern. SMDs capture information such as the states an object can be in during its lifetime, how the object responds to various events while in each state, and how the object transits from one state to another. In contrast to sequence diagrams that capture object behavior one scenario at a time, SMDs capture the object’s behavior over its full life-cycle.

    An SMD for the Minesweeper game.